
SEAWALLS · SEA LEVEL RISE
Sea Level Rise by 2050: What It Means for Your Seawall
Sea level along the U.S. coastline is expected to rise 10 to 12 in. (0.25 to 0.30 m) on average between 2020 and 2050, as much as it rose over the previous 100 years, according to NOAA’s 2022 Sea Level Rise Technical Report. The Gulf and East Coasts are expected to see more, the West Coast less. Here are the numbers for your coast, what higher water does to an existing seawall, and how a wall can be raised without tearing it out. See the 2050 numbers.
Key takeaways
- 2050: NOAA expects 10 to 12 in. of sea level rise on average along the U.S. coast between 2020 and 2050.
- Location matters: about 14 to 18 in. on the Gulf Coast and 4 to 8 in. on the West Coast, because land motion changes the local number.
- Flooding grows faster than the water: moderate high tide floods go from 0.3 to about 4 a year on average by 2050.
- Older walls are already behind: at Galveston’s trend, a wall built in 1975 has seen about 13 in. of rise.
- Raise it in place: FRP panels bolted to both faces of the existing cap and filled with concrete add height without demolition.
How much will sea levels rise by 2050?
NOAA expects relative sea level along the contiguous U.S. coastline to rise 0.25 to 0.30 m, about 10 to 12 in., on average between 2020 and 2050. The interagency 2022 Sea Level Rise Technical Report (Sweet et al.) says that is as much rise in 30 years as the coast saw over the last 100 years (1920 to 2020), and that several lines of evidence now give higher confidence in that 2050 range regardless of the emissions pathway.
The rise will not be the same everywhere. Land sinking or rising, ocean currents and other regional effects change the local number. The report gives the regional differences in centimeters relative to the national average. The inch ranges below are our conversion of those differences, added to the 0.25 to 0.30 m average.
| Coast | Difference from the U.S. average | Approximate rise by 2050 |
|---|---|---|
| U.S. average (contiguous) | Baseline: 0.25 to 0.30 m | About 10 to 12 in. |
| East Coast | 0 to 5 cm higher | About 10 to 14 in. |
| Gulf Coast | 10 to 15 cm higher | About 14 to 18 in. |
| West Coast | 10 to 15 cm lower | About 4 to 8 in. |
| Hawaii and Caribbean | 5 to 10 cm lower | About 6 to 10 in. |
Source: NOAA, 2022 Sea Level Rise Technical Report, Key Message 1 (February 2022). Inch ranges are our arithmetic on the report’s centimeter values and are rounded. The projections exclude year-to-year swings such as El Niño.
Beyond 2050 the range widens, because it depends on future emissions and on how the ice sheets respond. The report puts relative sea level along the contiguous U.S. at about 0.6 to 2.2 m (2 to 7 ft) higher in 2100 than in 2000 across its scenarios. NOAA notes the report is not meant to be design guidance for a specific project, so your engineer will pick the scenario and planning horizon for your wall.
How much has sea level already risen?
Global sea level has risen about 8 to 9 in. (21 to 24 cm) since 1880, and the rate is speeding up. NOAA Climate.gov reports that the rate more than doubled, from 0.06 in. (1.4 mm) per year for most of the 20th century to 0.14 in. (3.6 mm) per year from 2006 to 2015, and that global sea level set a record in 2023 at 3.99 in. (101.4 mm) above 1993 levels.
Along U.S. coasts the local rise has been larger. NOAA’s technical report estimates that global mean sea level rose about 17 cm over 1920 to 2020, while relative sea level averaged around the contiguous U.S. rose about 28 cm (11 in.), with acceleration starting around 1970. Sinking land in places like coastal Louisiana and Texas adds to the ocean’s rise.
What do NOAA tide gauges show for my coast?
NOAA tide gauges show sea level rising at every major U.S. station in the table below, from about 0.4 in. per decade in Los Angeles to more than 3.5 in. per decade at Grand Isle, Louisiana. These are long-term linear trends over each gauge’s full record, so they do not show the recent acceleration.
| Tide gauge | Record starts | Trend (in. per decade) | About (in. per century) |
|---|---|---|---|
| Boston, MA | 1921 | 1.17 | 12 |
| The Battery, New York, NY | 1856 | 1.16 | 12 |
| Atlantic City, NJ | 1911 | 1.67 | 17 |
| Sewells Point (Norfolk), VA | 1927 | 1.90 | 19 |
| Charleston, SC | 1901 | 1.38 | 14 |
| Key West, FL | 1913 | 1.04 | 10 |
| St. Petersburg, FL | 1947 | 1.23 | 12 |
| Galveston Pier 21, TX | 1904 | 2.61 | 26 |
| Grand Isle, LA | 1947 | 3.59 | 36 |
| San Francisco, CA | 1897 | 0.78 | 8 |
| Los Angeles, CA | 1923 | 0.42 | 4 |
Source: NOAA Tides and Currents, Relative Sea Level Trends, data through December 15, 2025, retrieved October 20, 2026. Per-century values are the decade trend times 10, rounded. Trends include local land motion, which is why they differ so much between nearby coasts.
Why are sea levels rising?
Sea levels are rising for two main reasons: ocean water expands as it warms, and melting glaciers and ice sheets add water to the ocean. NOAA’s National Ocean Service notes that the ocean is absorbing more than 90 percent of the increased atmospheric heat associated with emissions from human activity.
Locally, land movement matters as much as the ocean. The NOAA technical report points to vertical land motion, including sinking land, as a reason local rise can be worse than the global average. That is why the Western Gulf, where land is subsiding, shows the largest expected rise, and why the tide gauge numbers vary so much from place to place.
How will sea level rise change coastal flooding?
Higher seas turn rare floods into routine ones. By 2050, NOAA’s technical report expects major and moderate high tide floods to occur about as often as moderate and minor floods do today, if no other risk-reduction measures are taken.
| Flood level | Height above high tide (MHHW) | Events per year, 2020 | Events per year, 2050 |
|---|---|---|---|
| Minor (disruptive) | About 0.55 m (1.8 ft) | About 3 | More than 10 |
| Moderate (typically damaging) | About 0.85 m (2.8 ft) | 0.3 | About 4 |
| Major (often destructive) | About 1.20 m (3.9 ft) | 0.04 | 0.2 |
Source: NOAA, 2022 Sea Level Rise Technical Report, Key Message 2. Heights in feet are our conversion. The East and Gulf Coasts are expected to flood at or above the national average.
This is already happening. NOAA Climate.gov reports that high-tide flooding is now 300% to more than 900% more frequent than it was 50 years ago. And the exposure is large: NOAA Office for Coastal Management counts 129 million people, almost 40 percent of the U.S. population, living in coastal counties.
Is your seawall high enough for 2050?
Send us the wall type, its height and the water levels you need to hold back. Our team will recommend the right QuakeWrap® system and provide specifications for your engineer.
What does rising water do to an existing seawall?
Rising water makes an existing seawall do more work than it was designed for. Even a modest rise changes the loads and the exposure:
- More frequent overtopping. Water spills over the wall more often at high tide and in storm surge.
- Higher water pressure. Aging walls carry more hydrostatic pressure than they were built for.
- Faster corrosion. The splash zone moves up the wall, and steel sheet piles and reinforcing steel corrode faster.
- Soil loss. Seepage and erosion wash soil out from behind the wall, which undermines it from the land side.
New York Sea Grant gives a simple field test: if the ground behind your wall stays wet or collects debris after heavy waves, the wall is too low for the conditions. Spray is acceptable, but “green water” over the top is a bad sign, and one remedy it names is adding onto the structure to make it higher. For other warning signs, see why seawalls fail.
Can an existing seawall be raised?
Yes. An existing seawall can often be raised by building a new reinforced extension on top of its cap instead of replacing the wall. ESeaWall™ is QuakeWrap®’s system for doing that with the same SPiRe®+ FRP panels used for seawall repair.
As Prof. Mo Ehsani describes in Concrete International (April 2025), panels are connected to the top edge of the existing seawall cap, more panels are placed on the opposite side, the two layers are bolted together and the space between them is filled with concrete. The result is a wall extension that often needs no additional reinforcing bars.
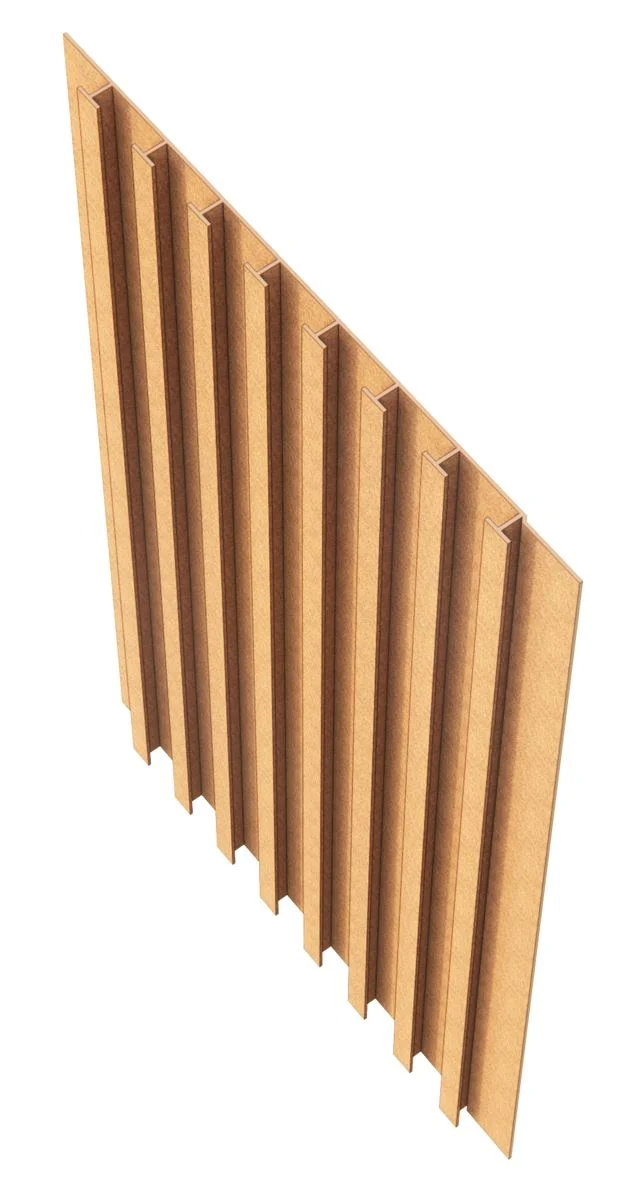
The panels are what make that possible. Each SPiRe®+ panel is 3 ft (914 mm) wide, 6 to 20 ft long and weighs 3.57 lb/sq ft. Its outside face is smooth and stays visible after installation. The inside face has protruding T profiles and a grit coat that bonds to concrete, and the June 2026 data sheet rates the panel as equivalent to No. 6 Grade 60 steel bars at 3.5 in., enough tension reinforcement that most extensions need no added rebar. The panels are patent-pending, and the data sheet lists “extending seawall height for protection against flooding in coastal and river front communities” as one of their uses.
- Connect to the wallPanels are connected to the top of the existing seawall cap.
- Seal and extendEach overlapping edge is sealed and more panels are added for as long as needed.
- Add the land sidePanels go on the land side and the two faces are connected with through-bolts. Non-corroding GFRP bars can be added if the design calls for them.
- Seal and fillThe bottom and side edges are sealed and the space between the panels is filled with concrete.
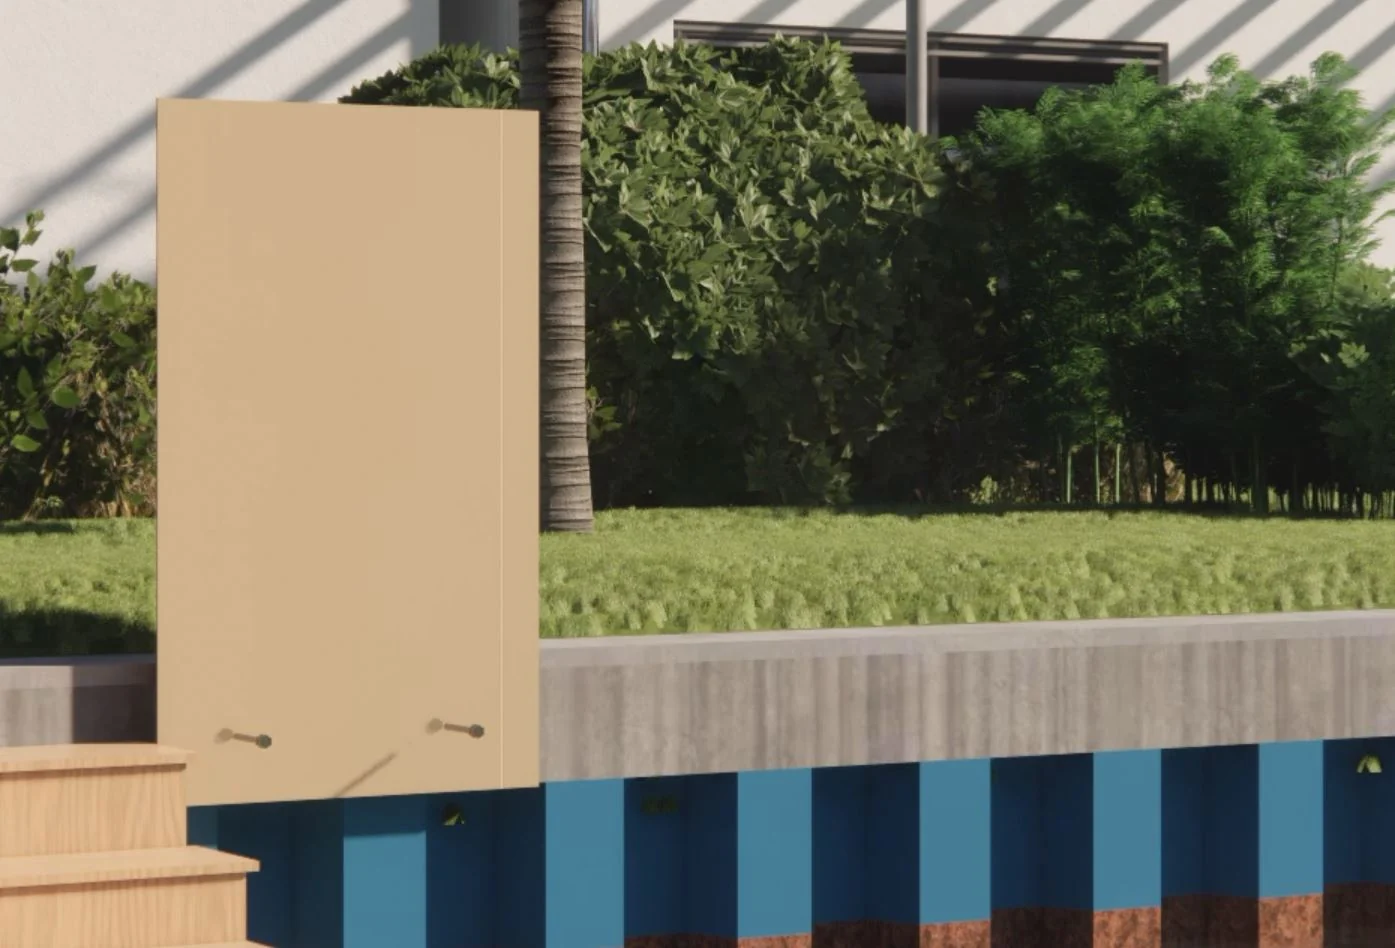
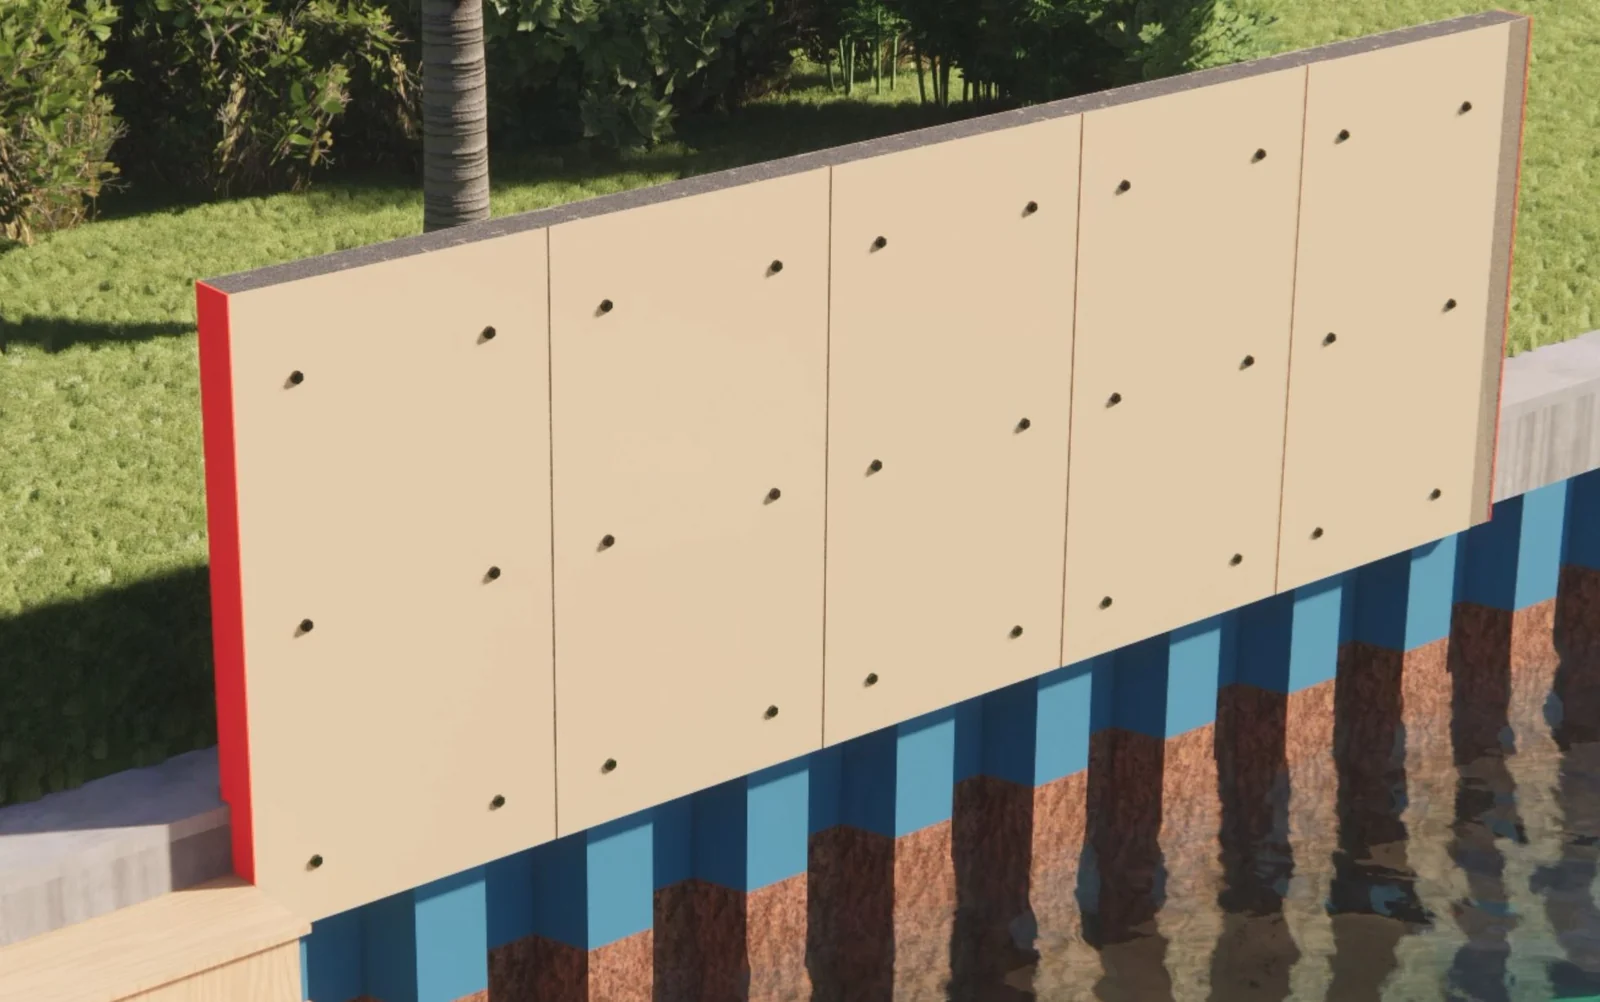
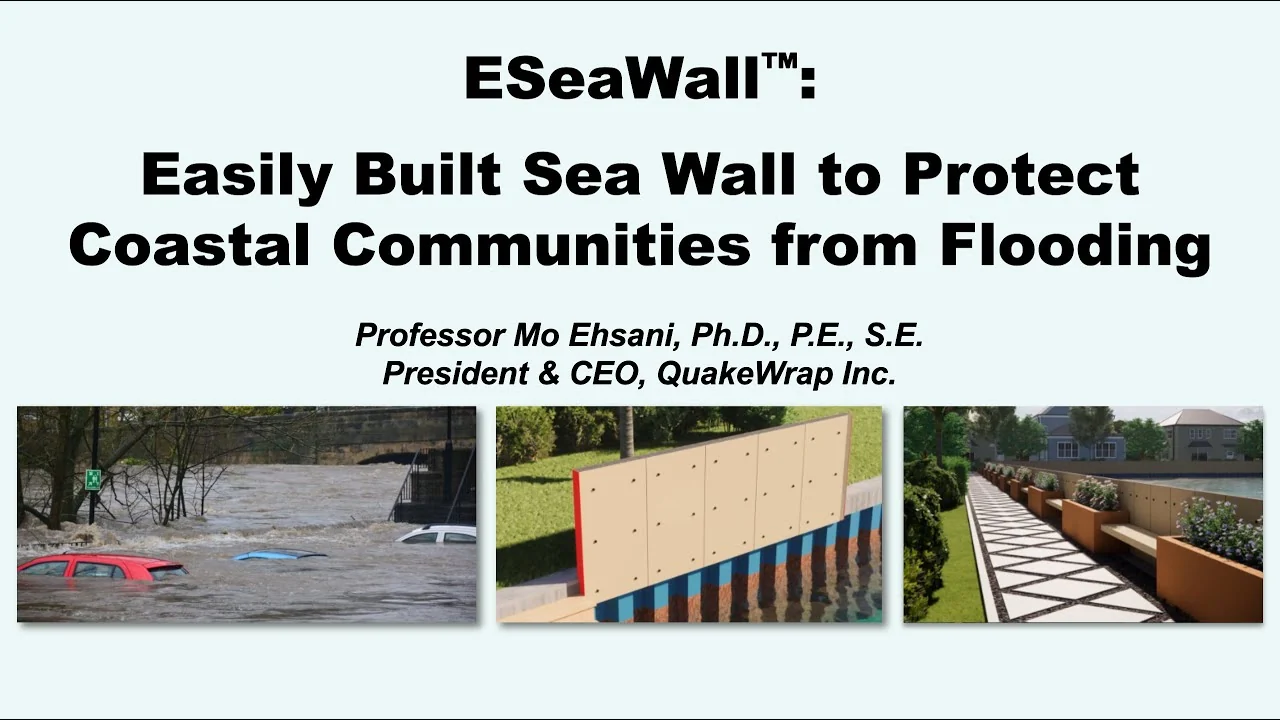
Plays from YouTube
What are the advantages of raising a seawall with FRP panels?
The biggest advantage is that the existing wall stays. There is no demolition and only limited excavation, which keeps cost, disruption and environmental impact down.
- Fast to install. Lightweight panels go on by hand, and installation can often be completed in days instead of weeks.
- Non-corroding. No steel in the panels, and the shell keeps moisture and oxygen off the concrete.
- Any length and height. Walls can be raised to the level needed, and strength adjusted for field conditions.
- Usually no rebar. The T profiles act as the reinforcement in most applications.
- Good looking. The smooth face stays visible, and walkways, planters and benches can be added on the land side.
It suits steel sheet pile seawalls, timber bulkheads and concrete seawalls, along with pump stations and retaining walls, for homes, condominium associations, ports, harbors and industrial waterfronts. As of September 2025, Prof. Ehsani wrote that raising seawalls with SPiRe®+ panels was being implemented on multiple Florida projects. The same idea, applied to earth embankments, is covered in preventing earth dam overtopping.
How high should my seawall be?
Your engineer of record sets the height, based on your site’s tide data, storm surge, waves and the sea level scenario your community plans for. Some municipalities have passed regulations requiring that flooding from rising seas be addressed, so check local requirements before you design, and plan for the permits a waterfront project needs. See environmental permitting for marine repairs.
Our team will recommend the right QuakeWrap® system and provide product data, specifications and sample design details for your engineer. If the wall itself is corroded, the extension and the repair can be planned together; see seawall repair cost for typical prices.
Sea level rise and seawall FAQs
How much will sea level rise by 2050?
NOAA’s 2022 technical report expects 10 to 12 in. (0.25 to 0.30 m) of rise on average along the contiguous U.S. coastline between 2020 and 2050, with more on the Gulf and East Coasts and less on the West Coast.
How much will sea level rise by 2100?
The same report puts relative sea level along the contiguous U.S. at about 0.6 to 2.2 m (2 to 7 ft) above 2000 levels by 2100, depending on emissions and ice sheet response.
Is sea level rise speeding up?
Yes. NOAA reports the global rate more than doubled, from 1.4 mm per year for most of the 20th century to 3.6 mm per year from 2006 to 2015.
Which U.S. coasts are rising fastest?
The Gulf Coast, where land is sinking. NOAA’s Grand Isle, Louisiana, gauge shows 3.59 in. per decade and Galveston, Texas, 2.61 in. per decade, compared with 0.42 in. in Los Angeles.
Can an existing seawall be raised?
Yes. With ESeaWall™, FRP panels are connected to both faces of the existing seawall cap, bolted together and filled with concrete, often without added rebar. Your engineer of record confirms the existing wall can carry the extension.
Do I have to remove my old seawall to raise it?
No. ESeaWall™ is built on the existing wall, so there is no demolition and only limited excavation.
Where does the name ESeaWall™ come from?
QuakeWrap® ran a naming contest in summer 2023 with a $1,000 prize. The winning name reflects how easily the seawall is built.
Sources
- Sweet, W.V., et al., Global and Regional Sea Level Rise Scenarios for the United States, NOAA Technical Report NOS 01, February 2022 (Executive Summary and Section 1).
- NOAA Tides and Currents, Relative Sea Level Trends, data through December 2025, retrieved October 20, 2026.
- R. Lindsey, NOAA Climate.gov, Climate Change: Global Sea Level, August 22, 2023.
- NOAA National Ocean Service, Is sea level rising?, accessed October 20, 2026.
- NOAA Office for Coastal Management, Economics and Demographics (2020 Census data), accessed October 20, 2026.
- New York Sea Grant, Maintaining Shoreline Erosion Control Structures, C. O’Neill, 2002.
- M. Ehsani, Evolution of FRP Products for Concrete Repair, Concrete International, April 2025.
- QuakeWrap, Inc., SPiRe®+ Panel product data sheet, June 2026.
Is Your Seawall High Enough?
Tell us about the wall and the water levels you need to hold back. Our team will recommend the right QuakeWrap® system and provide specifications for your engineer.